
AIDSVu has released a new set of infographics featuring the first-ever publicly available state-level data and regional maps on PrEP use by race and ethnicity, from 2012 to 2021. While use of PrEP has increased an average of 56% each year since its approval in 2012, the graphics depict major inequities in PrEP use among people who are Black and Hispanic, and in the southeastern U.S.
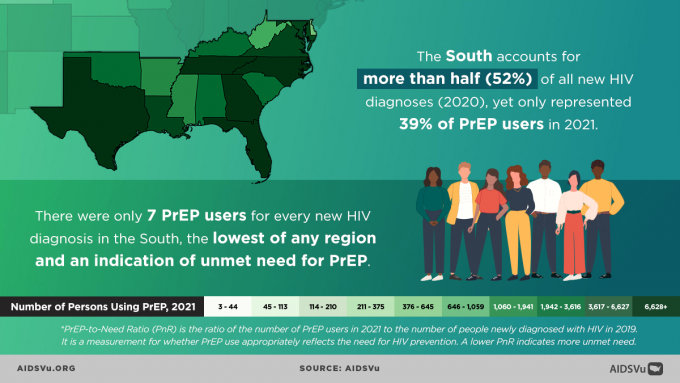
The southeast (from Texas to Maryland) accounted for 52% of new HIV diagnoses in 2020, according to one of the infographics, yet represented just 39% of PrEP users in the U.S. in 2021. The region also has the states with the highest unmet need for PrEP—Alabama, Arkansas, South Carolina, and Mississippi. (Although not a state, Puerto Rico also falls under the category of greatest unmet need. Puerto Rico is a U.S. territory.)
“It is important that data do not live in a vacuum and that the insights we glean from research are translated into policy and action,” said Patrick Sullivan, DVM, PhD, professor of epidemiology at Emory University’s Rollins School of Public Health and principal scientist for AIDSVu. “Visualizing PrEP use data on AIDSVu draws attention to underserved people and geographic regions and helps prevention programs better allocate resources to ensure PrEP reaches the people and communities with the greatest unmet need for PrEP.” Dr. Sullivan presented the report on PrEP inequity at this year’s International AIDS Conference.
AIDSVu provides interactive maps that visualize the impact of HIV on communities across the U.S. The site also offers tools and resources to find local services. Go to aidsvu.org.
Dr. Sullivan discusses AIDSVu’s first-ever publicly available state-level data and maps on PrEP by race and ethnicity here.
The media announcement of AIDSVu’s PrEP use data is here.